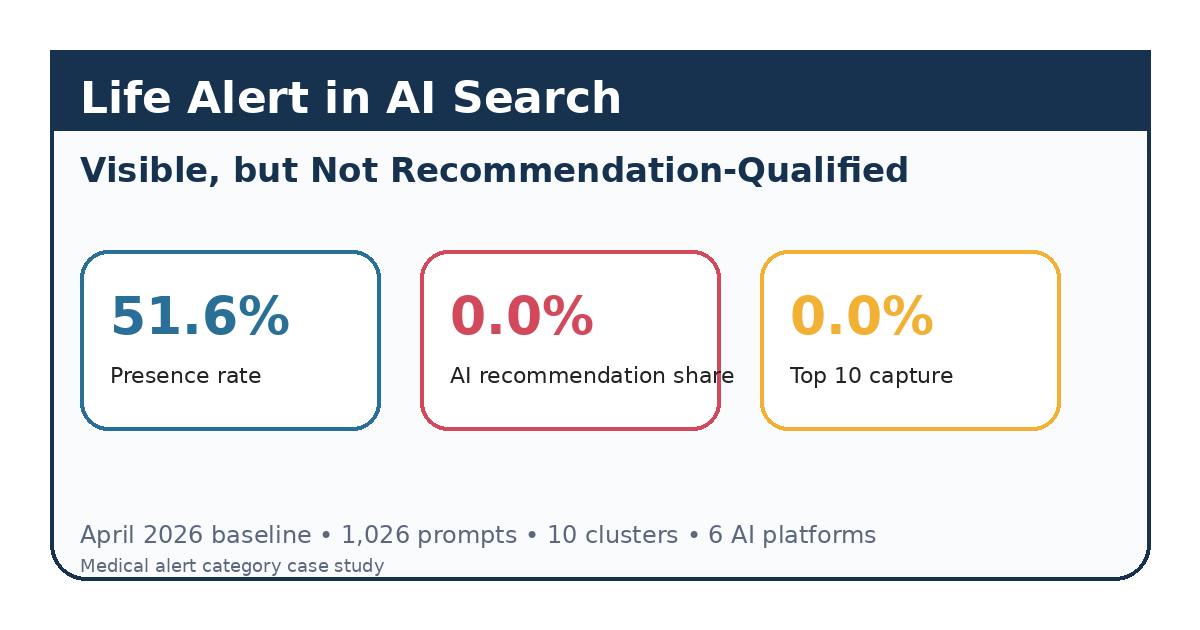
Life Alert in AI Search: Visible, but Not Recommendation-Qualified
April 2026 analysis of Life Alert across 1,026 AI prompts, 10 high-intent clusters, and 6 platforms: 51.6% presence, 0.0% AI recommendation share, and 0.0% Top 10 capture in the medical alert category.
In this article
- 01At a Glance
- 02Executive Summary
- 03The Core Pattern
- 04Demand Was Concentrated in a Small Number of Buying Moments
- 05Cluster-Level Findings
- 06Why Life Alert Was Visible but Not Recommendation-Qualified
- 07Which Competitors Occupied the Recommendation Layer
- 08Representative Prompt Examples
- 09Methodology
- 10Limitations
- 11Final Thoughts
Independent market analysis. Not client work.
At a Glance
- Company analyzed: Life Alert
- Vertical: Medical Alert Systems / Personal Emergency Response Systems (PERS)
- Report month: April 2026
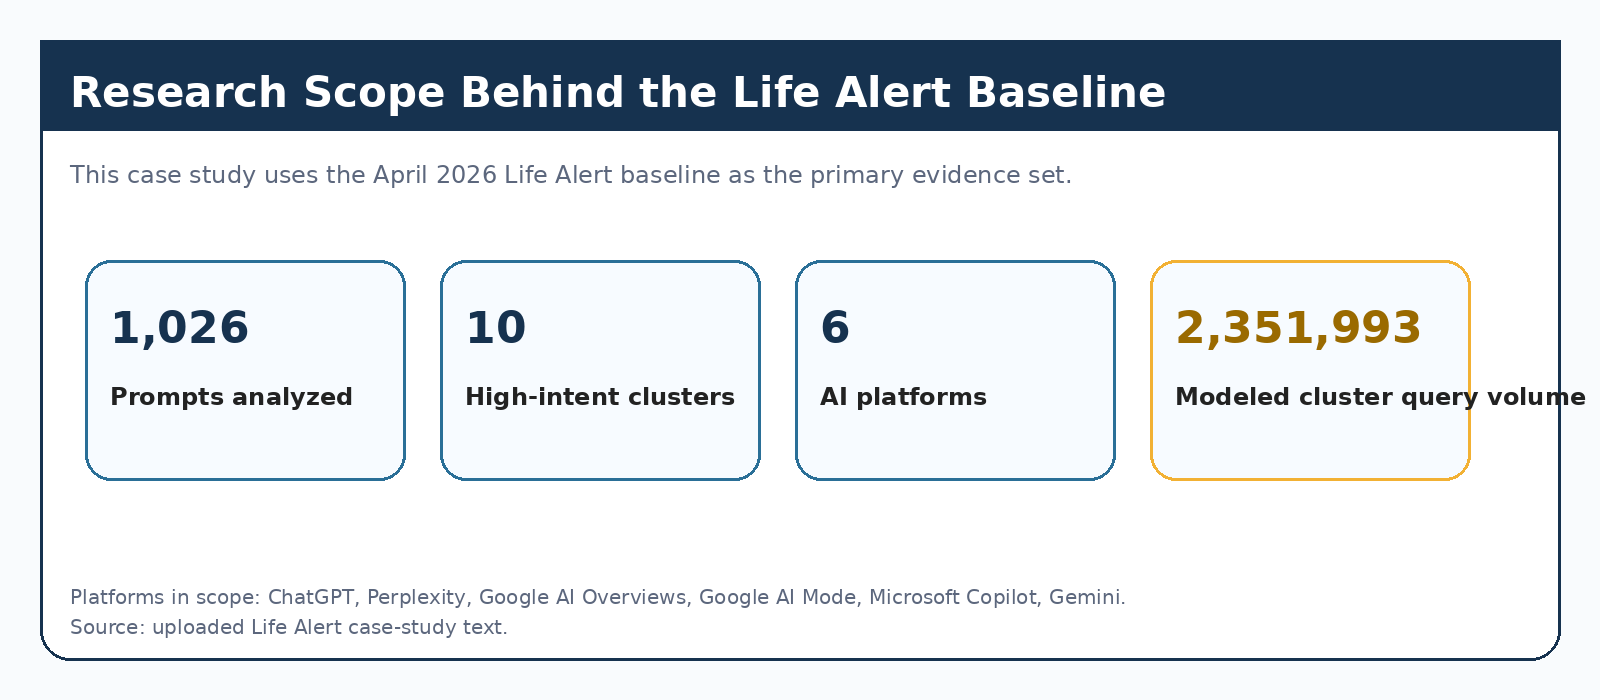
- Primary evidence set: 1,026 prompts, 10 high-intent prompt clusters, 6 AI platforms, 2,351,993 total modeled cluster query volume
- Platforms in scope: ChatGPT, Perplexity, Google AI Overviews, Google AI Mode, Microsoft Copilot, Gemini
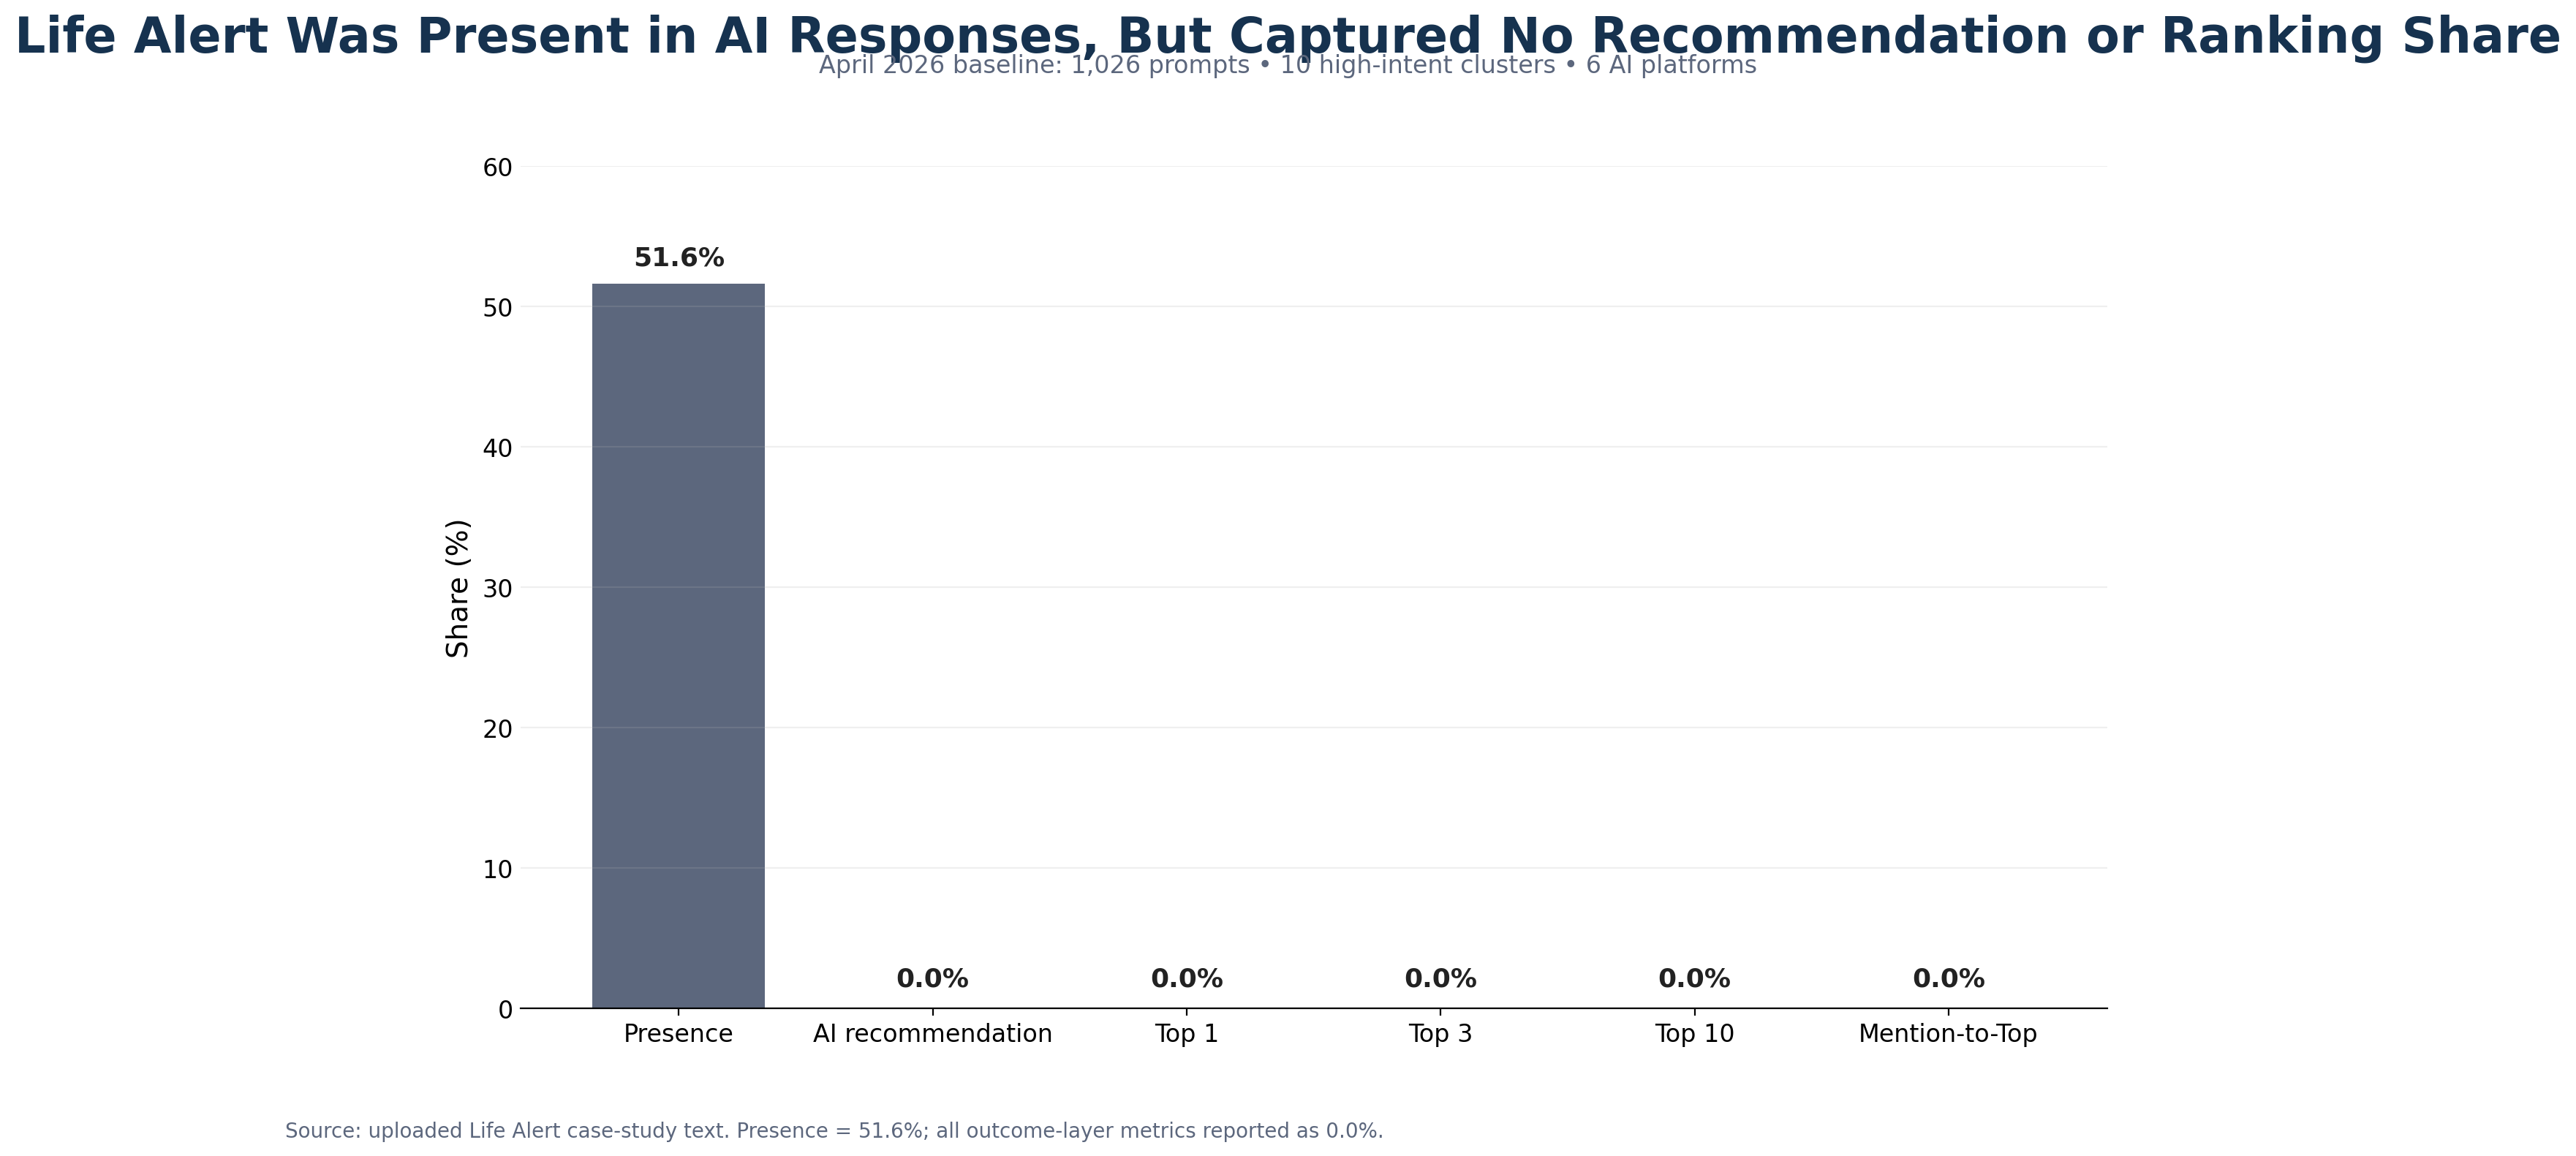
- Core finding: Life Alert had 51.6% presence across the baseline prompt set, but 0.0% AI recommendation share, 0.0% Top 1 share, 0.0% Top 3 share, 0.0% Top 10 share, and 0.0% mention-to-Top conversion.
Executive Summary
Life Alert entered AI-mediated consideration, but not AI-mediated preference. In the April 2026 LLM Authority Index baseline, the brand appeared in just over half of measured AI responses across six major platforms. That confirms broad recognition. But the outcome layer was absent: no measurable recommendation share, no measurable Top 1, Top 3, or Top 10 capture, and no measurable conversion from mention into ranked inclusion. This was not a discovery failure. It was a recommendation-qualification failure.
That pattern held across all ten high-intent buying clusters, including pricing, comparisons, alternatives, reviews, how-to-choose, and free-system prompts. The largest demand pools were exactly where the gap mattered most: Pricing at 1,137,893 modeled queries, Free Medical Alert Systems at 343,722, and Best Medical Alert Systems at 251,041. Relative competitor position in the baseline can only be stated directionally, because the report does not include a full competitor market-share table. Even so, the recommendation layer was consistently occupied by alternatives to Life Alert in commercially important buying journeys.
The Core Pattern
Life Alert was visible, but not recommendation-qualified.
That distinction matters. Presence rate measures whether a brand appeared at all. Ranking metrics measure where it appeared. Recommendation share is not treated as equivalent to ranking share unless the underlying packet explicitly provides that value. Citation frequency is also not treated as endorsement. The report keeps those layers separate on purpose. In this case, Life Alert had presence without recommendation capture and citations without persuasive recommendation power.
Demand Was Concentrated in a Small Number of Buying Moments
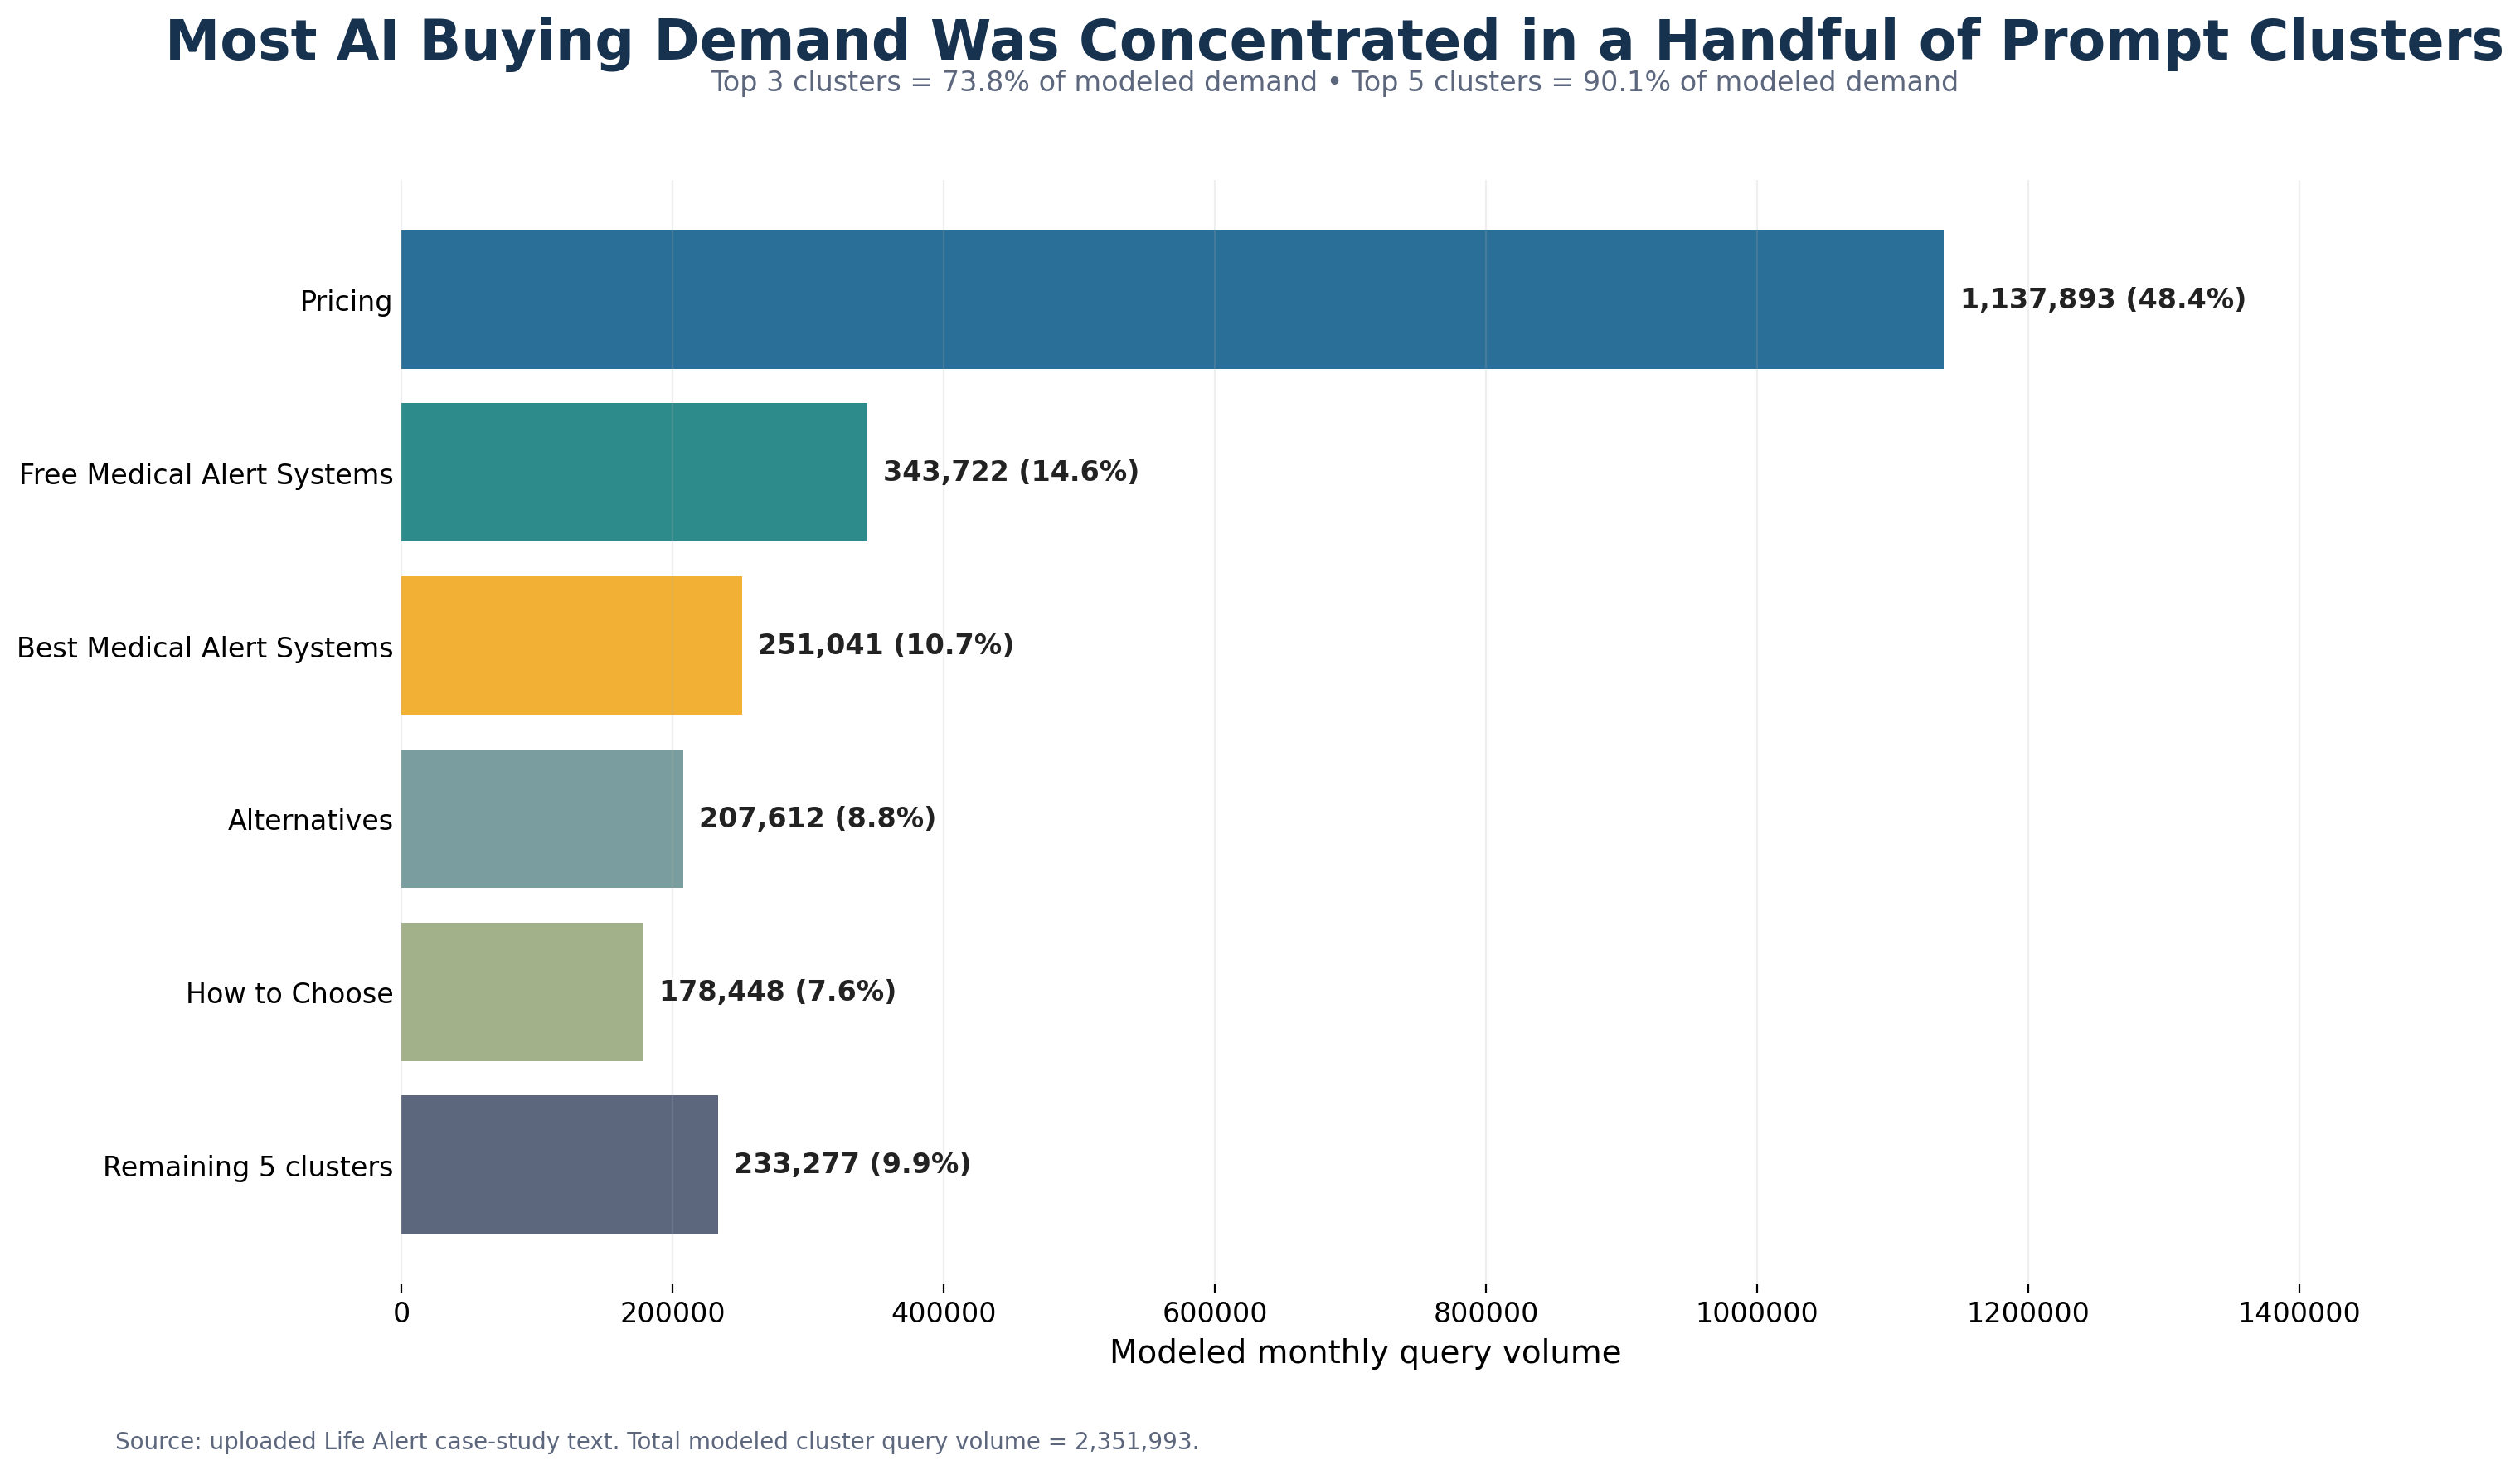
The strongest commercial concentration sat in a few clusters: Pricing at 1,137,893 queries or 48.4% of total measured demand, Free Medical Alert Systems at 343,722 or 14.6%, Best Medical Alert Systems at 251,041 or 10.7%, Alternatives at 207,612 or 8.8%, and How to Choose a Medical Alert System at 178,448 or 7.6%. The top three clusters accounted for 73.8% of measured query volume. The top five accounted for 90.1%.
Cluster-Level Findings
The pattern repeated across the highest-value clusters.
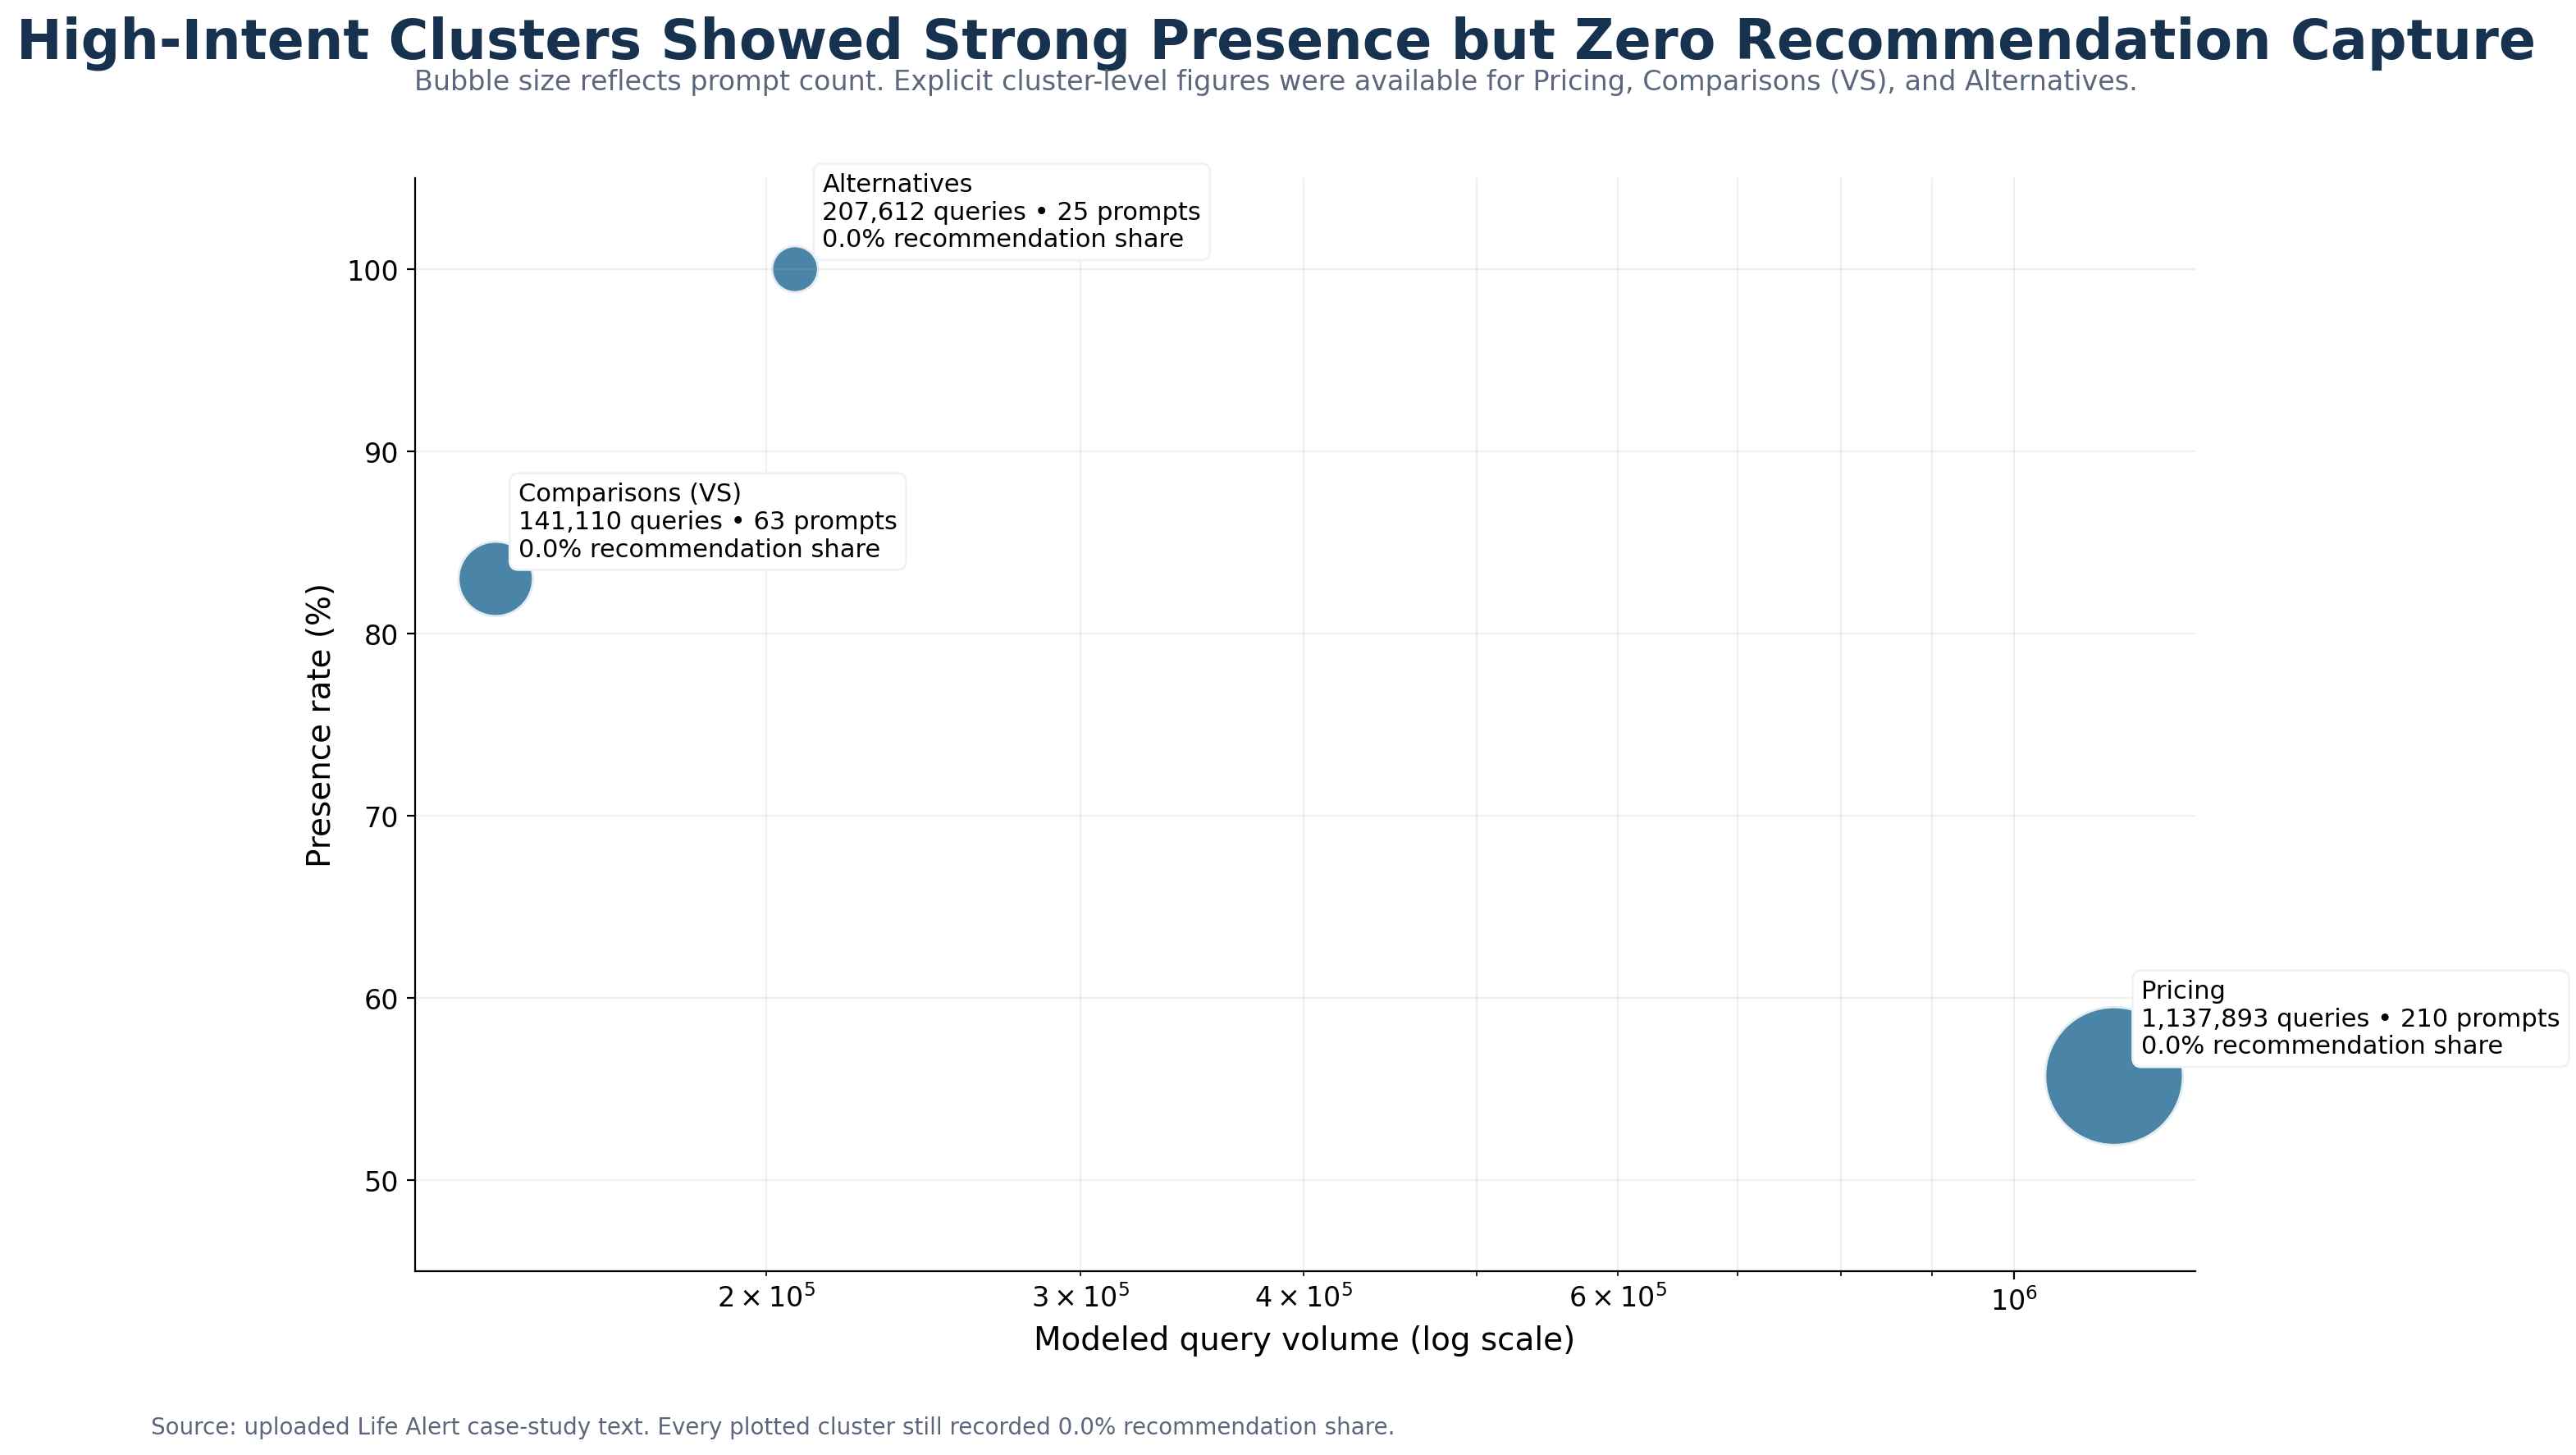
In Pricing, Life Alert appeared in 55.71% of prompts across 210 prompts and 1,137,893 modeled queries, but recorded 0.0% recommendation share and 0.0% ranking capture. In Comparisons (VS), Life Alert appeared in 83% of prompts across 63 prompts and 141,110 modeled queries, but again recorded 0.0% recommendation share and 0.0% ranking capture. In Alternatives, Life Alert had a 1.0 presence rate across 25 prompts and 207,612 modeled queries, yet still recorded 0.0% recommendation share and 0.0% ranking capture.
The same pattern held in Best Medical Alert Systems, How to Choose a Medical Alert System, Reviews, Free Medical Alert Systems, Features, and Legitimacy & Trust. The report’s recoverability view was mixed: Best, Comparisons, Reviews, Free, and Compare were classified as partially recoverable; Pricing, Alternatives, Features, How to Choose, and Legitimacy & Trust were classified as moderately recoverable. No cluster was classified as readily recoverable.
Why Life Alert Was Visible but Not Recommendation-Qualified
The evidence pointed to a source-architecture problem, not simply an owned-content problem.
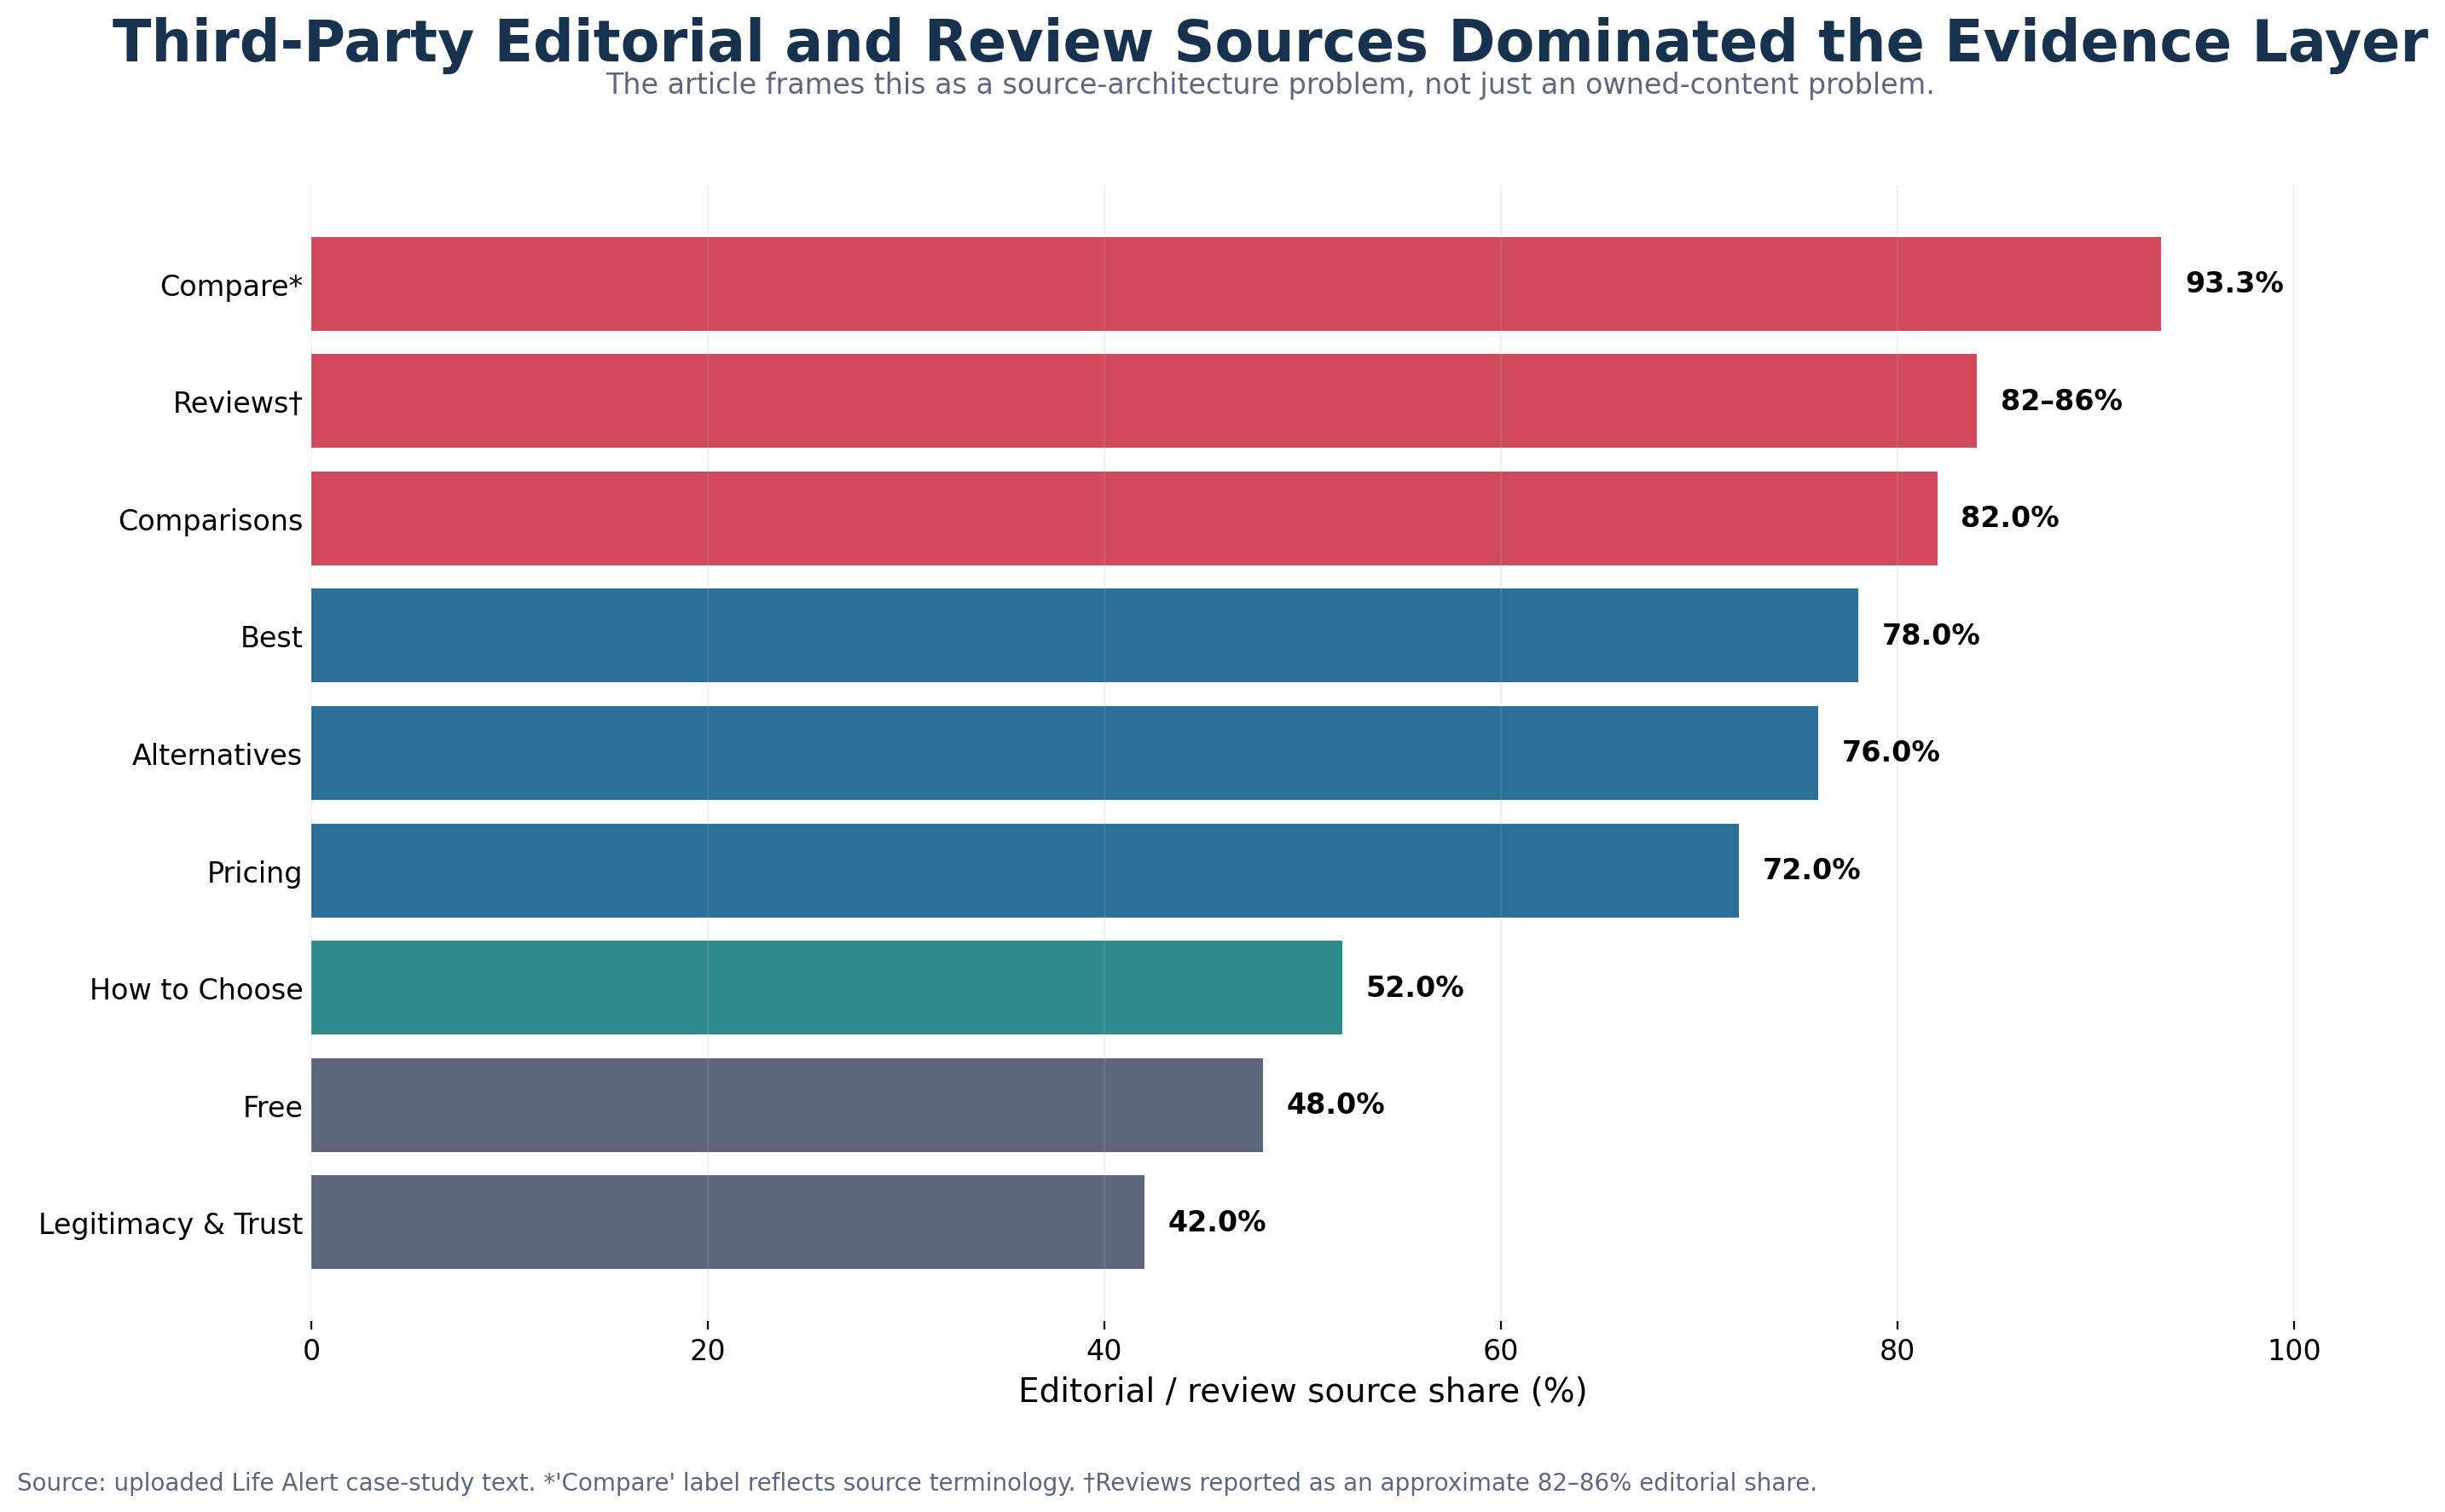
Across the baseline, third-party editorial and review domains dominated the evidence layer. Reported editorial-review shares were 0.78 in Best, 0.82 in Comparisons, 0.72 in Pricing, ~82-86% in Reviews, 0.76 in Alternatives, 93.3% in Compare, 0.52 in How to Choose, 0.48 in Free, and 0.42 in Legitimacy & Trust. The most repeatedly cited domains included ncoa.org, forbes.com, seniorliving.org, safehome.org, theseniorlist.com, realestate.usnews.com, safewise.com, retirementliving.com, assistedliving.org, and caring.com.
Life Alert’s own domain was present, but weakly positioned. In several clusters, lifealert.com was cited rarely, cited narrowly, or cited mainly for factual reference rather than endorsement. In Alternatives, the domain was cited once. In Pricing, it had an estimated 22 citations, but the report described the pricing narrative as non-transparent. In Features, lifealert.com contributed materially more citations than in most other clusters, yet even there the brand still recorded 0.0% recommendation and 0.0% ranking capture.
The directional snapshot reinforced the same conclusion at a broader framing level: five to seven editorial domains controlled roughly 72-93% of LLM citations in the vertical, competitor domains were cited 3-14x more often than lifealert.com, and when Life Alert appeared in AI responses it was often framed as the expensive, inflexible legacy option rather than as a recommended purchase choice. Those directional examples are useful, but they should be read as supplemental illustrations rather than as the primary market-share baseline.
Which Competitors Occupied the Recommendation Layer
The baseline report limits competitor claims to directional interpretation, but the supplemental directional packet identified a clear group of recurring displacers.
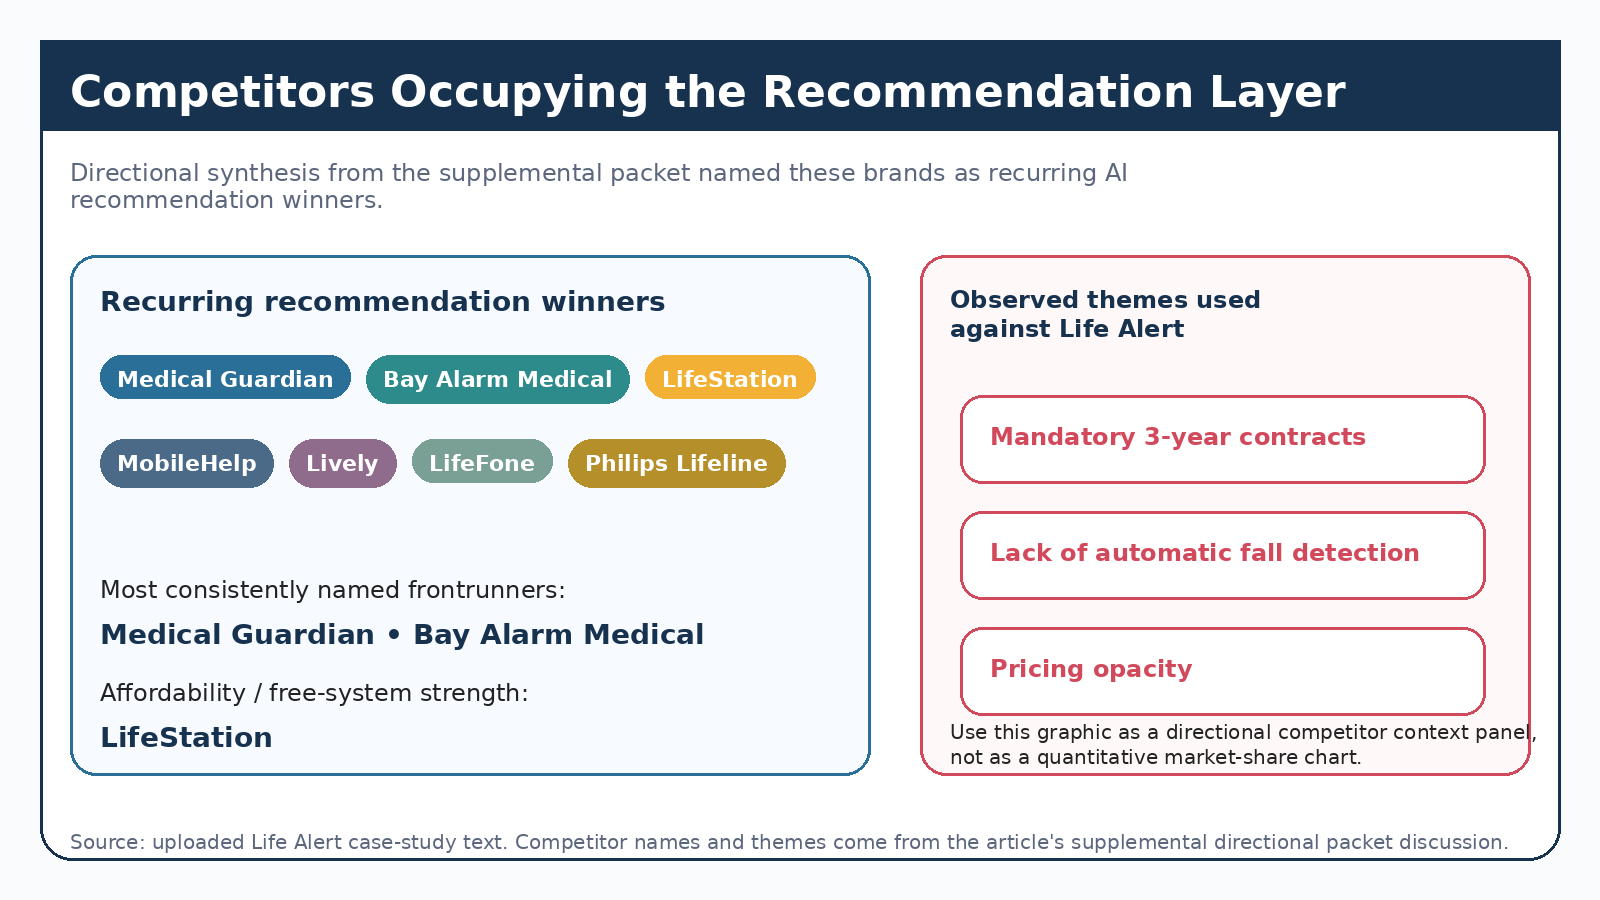
The most frequently named competitors occupying recommendation positions were Medical Guardian, Bay Alarm Medical, LifeStation, MobileHelp, Lively, LifeFone, and Philips Lifeline. Some prompt-level examples also surfaced Medical Care Alert and Alert1 in specific buying moments. The directional synthesis described Medical Guardian and Bay Alarm Medical as the strongest recurrent recommendation winners, with LifeStation especially strong in the free and affordability segment.
The directional packet also highlighted the product and evidence attributes most frequently used against Life Alert in AI answers: mandatory 3-year contracts, lack of automatic fall detection, and pricing opacity. Those factors should be interpreted as observed answer-layer themes in the supplemental packet, not as a legal or product review conclusion beyond the analyzed prompts.
Representative Prompt Examples
On "Is there a cheaper alternative to Life Alert?", associated with roughly 66,810 monthly searches in the supplemental packet, all six LLMs listed multiple competitor recommendations while framing Life Alert as the expensive problem to solve.
On "Life Alert vs Medical Guardian", associated with roughly 19,150 monthly searches, every major LLM positioned Life Alert as the more expensive, less flexible, and more feature-limited option.
On "How do I get a free life alert?", associated with roughly 64,919 monthly searches on Gemini in the supplemental packet, Life Alert was present but never recommended. The observed response pattern was to confirm that Life Alert did not offer free plans and then redirect users to alternatives such as LifeStation, Philips Lifeline, and Medical Care Alert.
On "What is the best medical alert system?", associated with roughly 9,925-10,440 monthly searches in the supplemental packet, Life Alert was absent from ChatGPT and Perplexity responses. The cited domains in those responses pointed to competitors and third-party review sources, not to Life Alert.
Even on "best life alert system," the supplemental packet documented cases where Google AI Mode redirected users to Medical Guardian, Bay Alarm Medical, and other modern alternatives while citing Life Alert's cost and contract constraints. Brand familiarity did not protect the brand from recommendation displacement.
Methodology
Primary source of truth
This case study uses the April 2026 Life Alert baseline report as the primary evidence set. That report covers 1,026 prompts, grouped into 10 high-intent prompt clusters, evaluated across 6 AI platforms: ChatGPT, Perplexity, Google AI Overviews, Google AI Mode, Microsoft Copilot, and Gemini. The reporting window is April 2026.
Supplemental evidence
To add named competitor examples and specific prompt illustrations, this case study also draws from a supplemental 919-observation directional packet built from AHREFs-derived prompt coverage across the same general vertical and platform set. That packet is explicitly described as directional and designed for lead-generation use. Where the two evidence sets differ in scope, the 1,026-prompt baseline controls the core case-study claims.
Prompt-cluster logic
Prompts were organized into commercial-intent clusters that reflect how buyers research the category. The baseline describes clusters including best-of, comparisons, pricing, reviews, alternatives, feature evaluation, how-to-choose, free-system, and trust or legitimacy prompts. Cluster findings should be interpreted inside their own prompt mix and query volume, not as interchangeable with total-market results.
Platform logic
The analysis covers six AI discovery and answer environments. Outputs can differ by platform because models rely on different retrieval layers, ranking behaviors, citation conventions, and source preferences. The report therefore looks for cross-platform patterns without assuming that every platform behaves identically.
Metric logic
The report separates presence rate from Top 1 / Top 3 / Top 10 ranking share, recommendation share from ranking share, citation frequency from endorsement, cluster-level outputs from total-market outputs, and directional modeled value from realized revenue. It intentionally avoids invented blended scores and unsupported monetized claims when the source packets do not support them.
Citation analysis logic
Citation analysis reviewed which domains and source types AI platforms relied on when constructing answers inside each cluster. This includes editorial review sites, official vendor domains, marketplace or directory sources, community forums, academic or government sources, and other referenced content. The goal is to understand which source environments shaped recommendation outcomes, not simply which sites were mentioned.
Limitations
This is a single-month baseline, not a historical trend study. The baseline should be read as a point-in-time view of AI visibility and recommendation patterns, not as momentum analysis. Some market-level fields in the supplied packets were unpopulated or null, and the report does not infer missing values when the data is not present.
The supplemental 919-observation packet also carries additional limitations. It states that some LLMs had thinner prompt samples in certain clusters, three clusters had data from only 2 of 6 platforms, and cross-platform prompt deduplication is approximate. Those examples are therefore useful for illustrating the shape of the problem, but they should not be mistaken for a full competitor market-share census.
Finally, relative competitor position in the baseline can only be stated directionally because the supplied total-market packet does not include a full market-wide competitor share table. This case study therefore names competitors where the supplemental evidence clearly supports doing so, while keeping the core baseline claims tightly bounded.
Final Thoughts
Get your free report to see how LLM Authority Index separates presence, recommendation share, ranking capture, citation architecture, and recoverability across AI buying journeys.
Keep reading
Related case studies
Case Study
The Visibility Trap: How AI Share of Voice Made a Brand Look Like It Was Winning While AI Was Sending Buyers Elsewhere
Methodology case study: share-of-voice–style scoring suggested strength in comparison and pricing, while sentiment-gated recommendation analysis showed 0% capture and cautionary framing—why the strategic diagnosis inverted.
ReadCase Study
Life Alert Pricing in AI Search: The Biggest Demand Cluster, Zero Recommendation Capture
In the April 2026 baseline, Pricing was Life Alert's largest AI buying-moment cluster: 1,137,893 modeled queries and 55.71% presence, but 0.0% AI recommendation share and 0.0% ranked capture.
ReadCase Study
Life Alert's Citation Architecture in AI Search: Why Visibility Did Not Become Recommendation
April 2026 analysis of Life Alert across 1,026 prompts, 10 high-intent clusters, and 6 AI platforms. The core finding: third-party editorial and trust sources shaped the recommendation layer, while Life Alert's own domain remained too weak, narrow, or reference-only to change purchase guidance.
Read